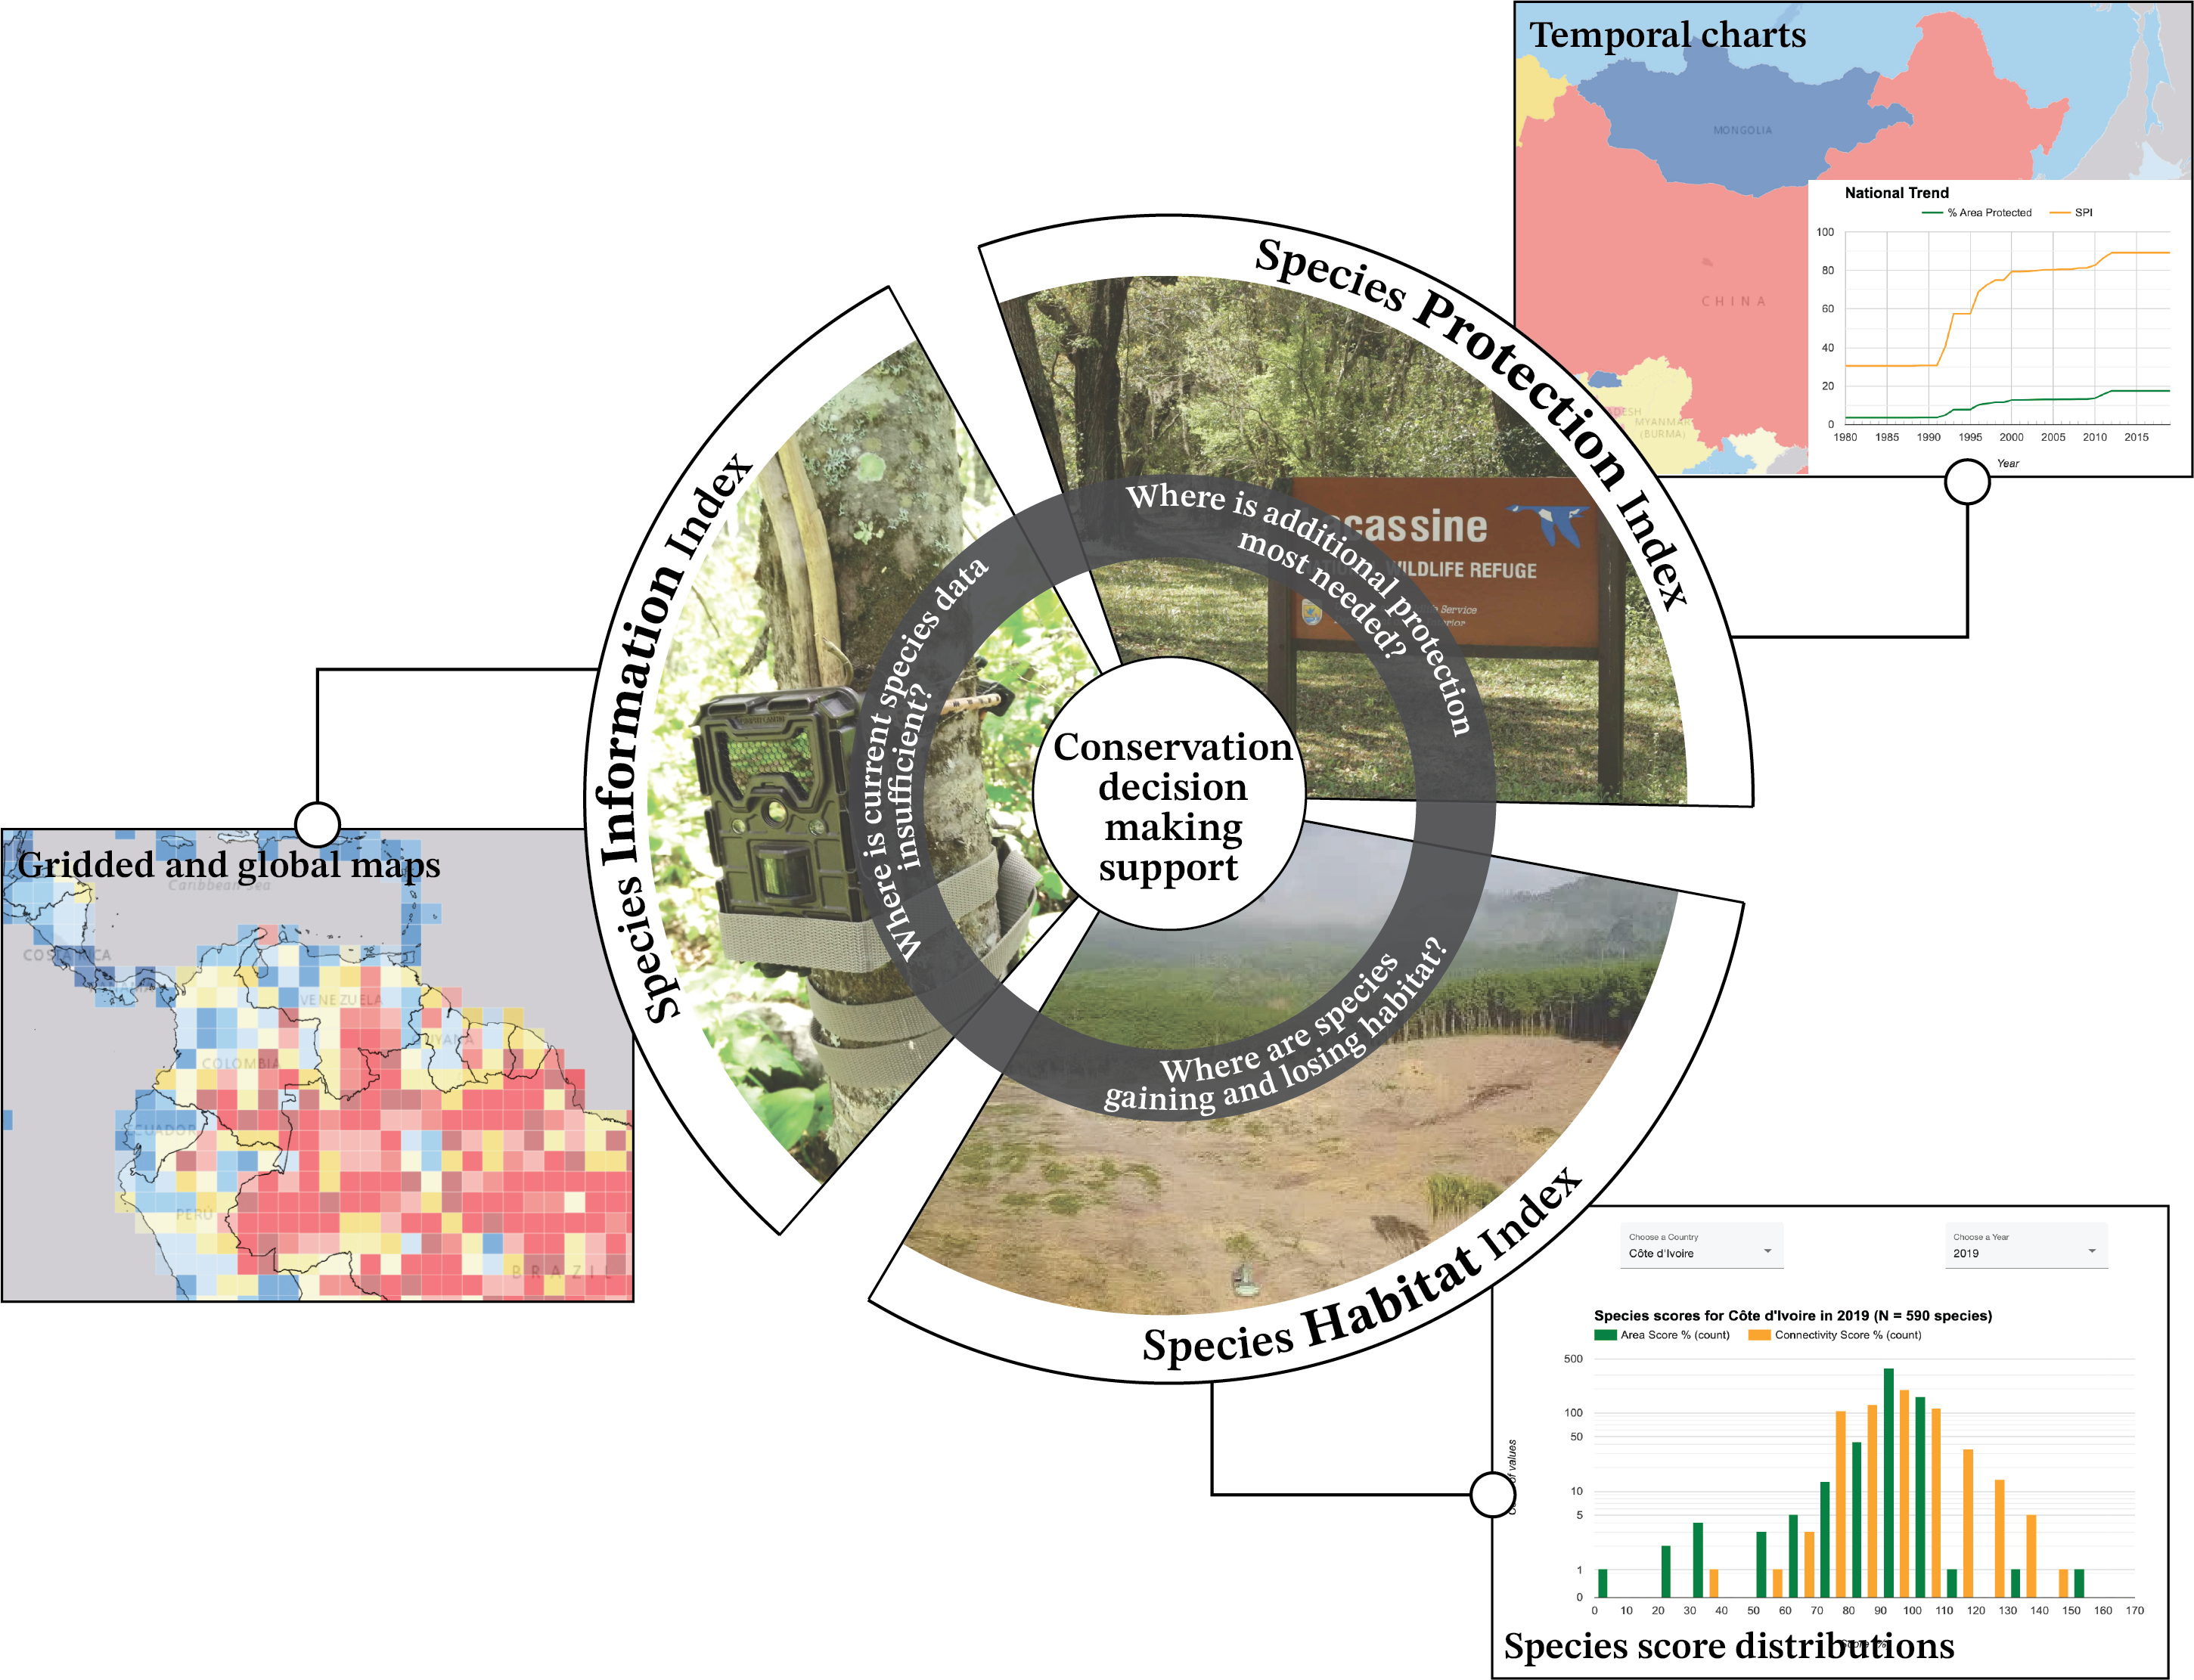
Our three biodiversity indicators quantitatively track the conservation status of individual species across three important dimensions: habitat loss, protected area coverage, and data collection. We leverage in-situ biodiversity data, remote sensing layers, and advanced computational workflows to scale these calculations up to thousands of species around the globe and aggregate species scores into national and sub-national indices for all countries.
The Global Biodiversity Framework has made bold commitments to meeting biodiversity conservation targets by 2030. Our indicators, adopted by the official Monitoring Framework, are designed to aid countries and conservation stakeholders in monitoring biodiversity by representing individual species at national scales to inform decision-making.
The Global Biodiversity Framework has made bold commitments to meeting biodiversity conservation targets by 2030. Our indicators, adopted by the official Monitoring Framework, are designed to aid countries and conservation stakeholders in monitoring biodiversity by representing individual species at national scales to inform decision-making.